Here are some of the most important pieces of information you’ll find in your IBT@Home report, with helpful hints on how to use them.
"Reliable comparisons can therefore be made over time, as your child sits the assessment each year, providing quantitative evidence of learning progress."
Dr Hingston
Your child’s scale score
You may already be familiar with scale scores and how they are used in reporting, but it is worth a quick recap as they are a key feature of IBT@Home reports.
Firstly, a scale score is different to a raw score. A raw score simply reflects the number of questions your child answered correctly in the assessment.
A scale score offers us more information. A scale score is a measurement that represents your child’s achievement on the scale for the subject.
Dr Jarrod Hingston, School Assessment Services Manager, explains that ‘the common scale in each assessment is a single measure that all the grade level tests in a single subject report against, just as people’s height is commonly measured by a metric ruler’.
The common scale means that if your child takes, for example, the grade 4 IBT Mathematics assessment one year and the grade 5 Mathematics assessment the next, you can see how your child has grown in their learning reflected in the increase in their scale score.
Helpful hint: In the IBT@Home suite, each subject (English, Mathematics and Science) reports against different scales, so it is not possible to compare your child’s scale scores across subjects. To properly understand your child’s score, it’s best to look at achievement bands, which provide descriptive information, as well as the comparison to international results to see how your child is progressing relative to their peers.
What progress typically looks like
IBT@Home reports also provide a picture of what progress typically looks like in each subject through the use of described achievement bands. These bands literally describe the skills and knowledge that your child has learnt so far, and the next steps in their learning progress.
Using both scale scores and achievement bands, your child’s report will help you see how they are progressing up the scale. We’ve included an image of the first page below so you can see an example of how this works.
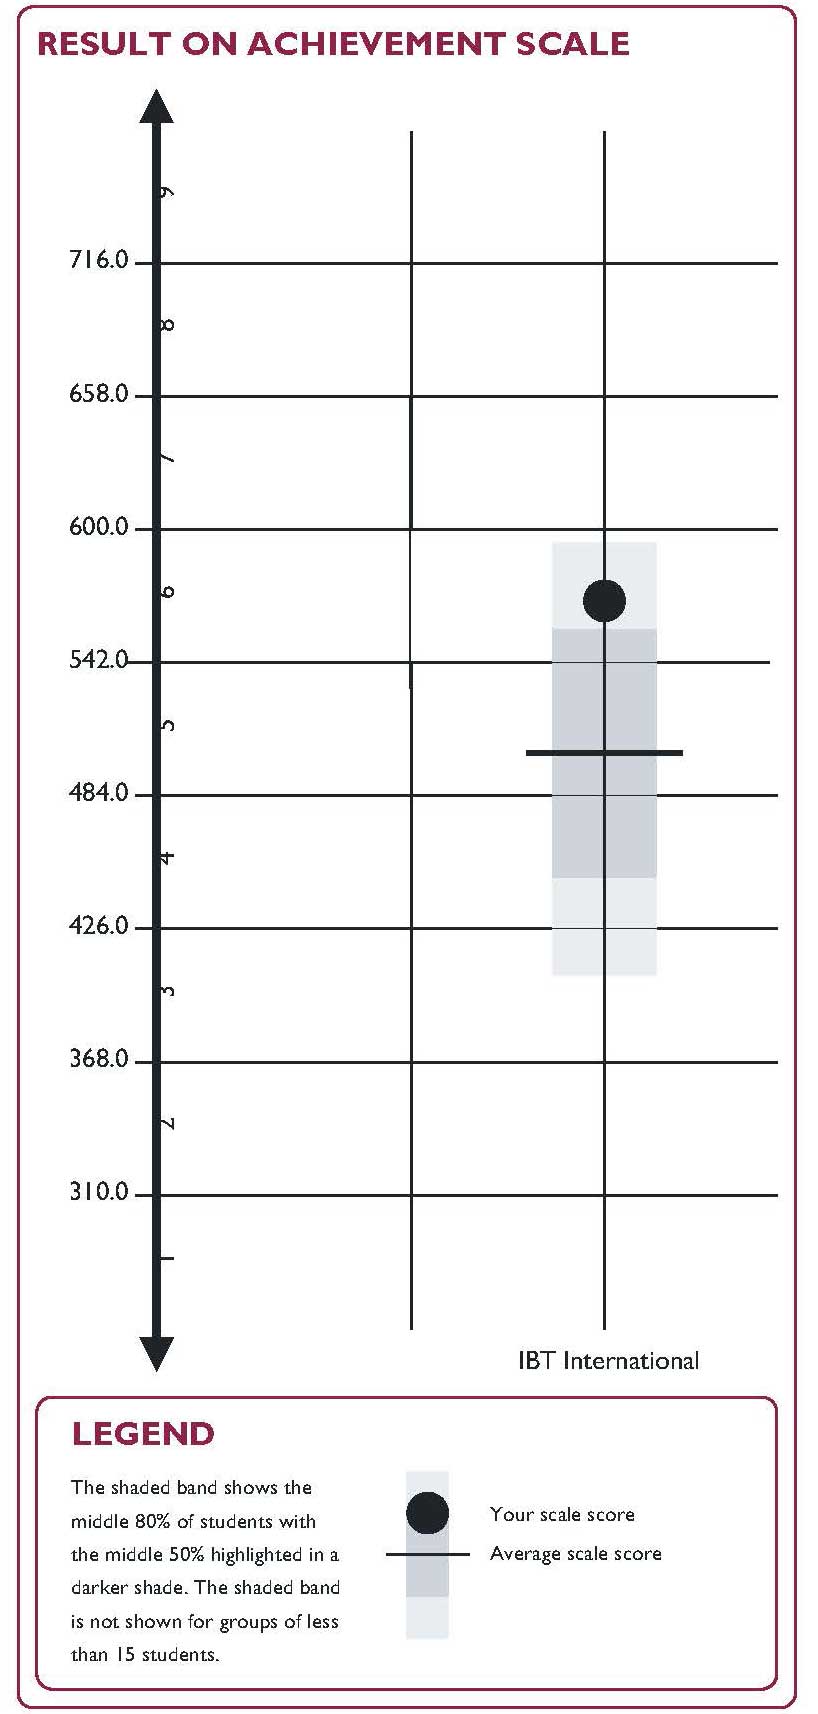
Here, the child’s scale score is represented by the black dot on the right of the graph, with the scale and achievement bands along the left of the graph. If the assessment is taken each year, we can see how the child progresses along the scale.
We can also see the context for the child’s scale score by looking at the achievement bands alongside the scale. In this case, the child is currently in the middle of band 6. This means that the child can typically demonstrate the skills described in bands 1-5 and most of the skills in band 6. The skills in the bands above their location on the scale (bands 7 and up) are skills they will be working towards. You can see more details about each achievement band in the later pages of your report.
IBT project director Mark Butler
Comparisons to students around the world
IBT@Home also provides you with a comparison to students who have taken IBT assessments around the world.
In the image above, you can see that the scale score is placed within a grey box plot. The lighter shade of grey shows where the middle 80 per cent of students placed on the scale, and the darker shade represents the middle 50 per cent. You can that this child is in the lighter shaded section at the top; this means that this child has achieved a higher scale score than average for this international group.
This international comparison offers you a sense of how your child is doing compared to their peers around the world – an additional piece of information to help you understand how your child is progressing in their learning.
Question-by-question detail
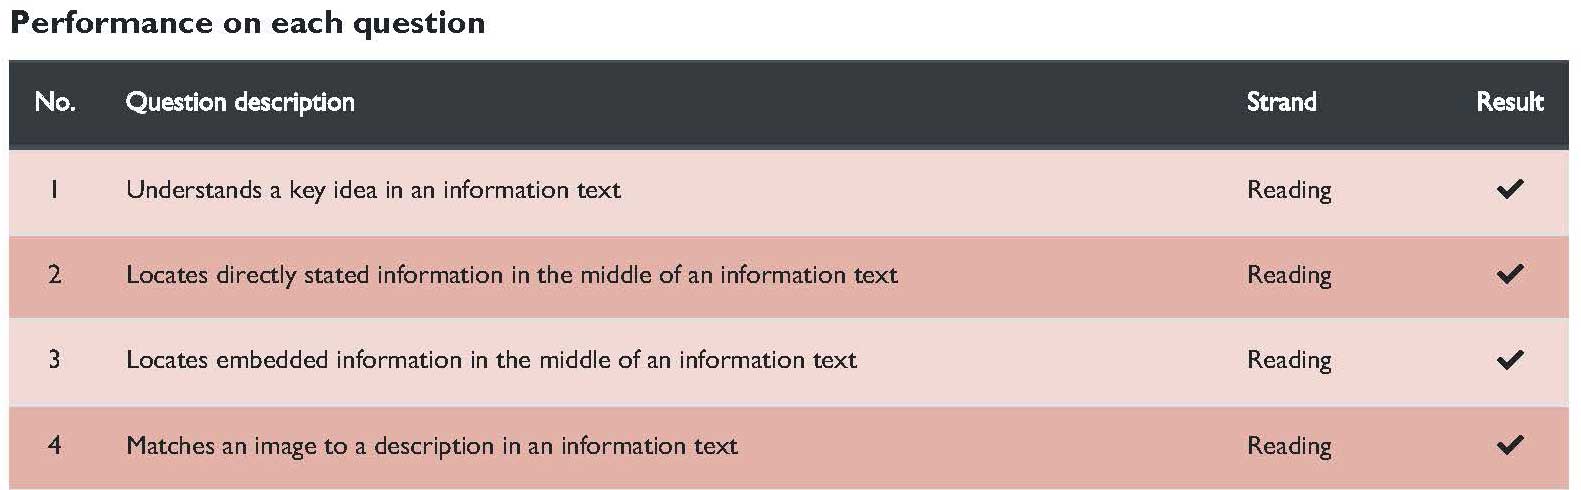
You can gather even more information about your child’s progress by looking at the question-by-question detail included in the report.
The reports show which questions were answered correctly and incorrectly and how difficult each of these questions is according to our international benchmarks.
You will also find your child’s result by ‘strand’, which are skill areas within each subject. For example, there are five strands in English: reading comprehension, spelling, punctuation, grammar and vocabulary.
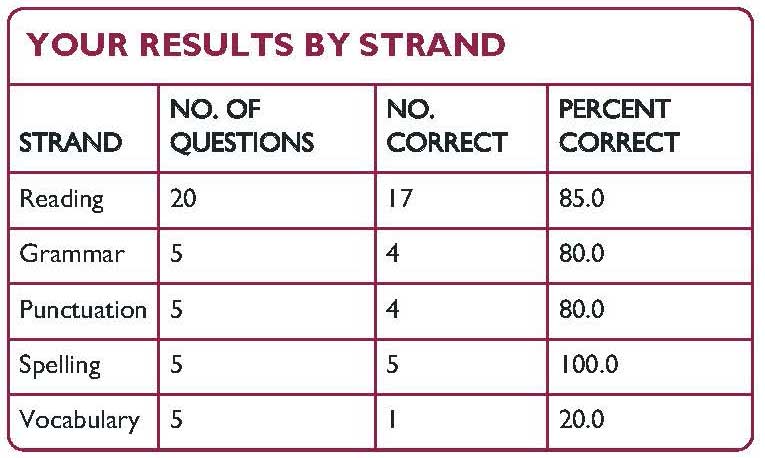
Helpful hint: To identify strengths and weaknesses, look for patterns in your child’s results. Do they seem to be getting more questions in a particular strand incorrect? Or are there strands where they are getting most of the questions right? Are there questions which the international group found easy that your child found more difficult?
For example, this child has excelled in spelling but needs further support with their vocabulary skills.
What can I do with this information?
It depends on your role in your child’s education!
The results can be useful to discuss with a tutor – you may even like to ask your child’s tutor to administer the test – so they can get a solid overview of where your child is in their learning.
If you are home-schooling your child, the reports can help you identify areas where your child is excelling and where they may need additional support.
By taking the assessment each year, you can track your child’s learning progress over time. By tracking this progress, you and your child can see that they are gaining knowledge and skills over time as they move up the achievement scale.
Sample reports
